Matthias Bressan

Skilled in data analysis, programming with Python, deep learning and statistics.
Master in Biology with experience in algae aquaculture, microbiology and bioinformatics.
Passionate about climate change and sustainability. A curious, team-oriented problem solver.
Predicting chlorophyll a content
In this project we want to calculate the chlorophyll a content (and therefore the phytoplankton) of the water column using abiotic factors.
This could be of interest as it means that one can predict phytoplankton concentration without the need of a photometer, potentially making it more cost effective. Disclaimer: as the dataset used is not openly available and the model might become part of a publication, I can’t show detailed data.
Dataset and preprocessing
The dataset used was created by Geomar (Kiel) using data that were measured at Boknis Eck, Eckenförde. Measurements of temperature, salinity, O2, various nutrients and chlorophyll a have been ongoing since 1957. More details on the dataset can be found in this publication by Lennartz et al. (2014).
After some initial data exploration, the dataset was prepared for the training. As some of the parameters were not measured non-stop, we cleaned the dataset from any row containing NaN, as well as columns containing unneeded parameters. The date was transformed to a week format (in hindsight, a sinewave encoding of the date might have been a better choice). Depth and chl a were grouped into different continuous categories and one-hot encoded. The last step was data normalization, where we opted for a min-max normalisation. Again, in hindsight a normalisation around the mean could have been the better choice as it is less susceptible for outliers.
NN architecture, training and results
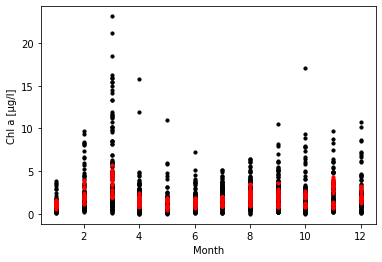
After testing various architectures, we opted for a dense neuronal network with three layers (128, 8 and 1 neurons) and a dropout of 0.2. Training was stopped when loss and validation loss converged. The predicted values (after denormalization) from the test set can be seen below. Red dots are the predicted values, black dots the actual values.