Matthias Bressan

Skilled in data analysis, programming with Python, deep learning and statistics.
Master in Biology with experience in algae aquaculture, microbiology and bioinformatics.
Passionate about climate change and sustainability. A curious, team-oriented problem solver.
Introduction
Statistical coupling analysis (SCA) uses coevolution between a protein’s amino acids to calculate groups of statistically independent amino acids called sectors. These sectors can be associated with different biochemical functions, like thermodynamical stability or substrate binding. In my thesis I used SCA to calculate possible sectors of the deoxyhypusine synthase (DHS), an enzyme that catalyses the first reaction in the activation of eukaryotic initiation factor 5a (eIF5a). It is a promiscuous enzyme that can bind to multiple substrates and uses NAD+ as a cofactor. Applying SCA to this enzyme might help to better understand which parts of it are responsible for interacting with substrates or cofactors.
What I learned
- Approaching an unknown method outside of my comfort zone in an autodidactic way
- Statistical methods like correlation matrices, singular value decomposition, principal components analysis and independent component analysis
- Working with an established Python package (SCA) and adding parts needed for my own work
- Working and approaching problems on my own, accompanied by a weekly meeting with my supervisor
SCA as a method
SCA as a method was developed by Rama Ranganathan and his group at the University of Texas Southwestern Medical School. For a more detailed description of SCA I recommend the paper Evolution-Based Functional Decomposition on Proteins (Rivoire et al. 2016).
In short, after calculating positional conservation, a covariance matrix is created by calculating the covariance of every amino acid at every possible pair of positions, weighted by a factor that takes positional conservation into account. The resulting tensor has four dimensions (L x L positions x 20 amino acids x 20 amino acids) and is then reduced to two dimensions (L x L positions) using singular value decomposition (SVD). This results in a two dimensional matrix where each position pairing is represented by the positional correlation of the most important amino acid at that position.
Principal component analysis (PCA) is then used to find groupings of positions that show maximum statistical independence from each other. The last step in the sector definition was applying independent component analysis (ICA) to the results in order to filter out certain statistical noises resulting from PCA. The final result are groups of positions clustered into so-called Independent Components (ICs).
While the name suggests that ICs are independent from one another, it was shown that a sector can be the sum of multiple ICs. Which ICs go together and which don’t can be determined either experimentally or by looking at the literature present for the protein you are analyzing.
Results
One of the key requirements for SCA to work properly is low sequence similarity, which was not fulfilled by the DHS sequences. This resulted in widely different ICs, depending on the sequence dataset and alignment method. We decided to counter this problem by taking the ICs resulting from four different approaches and look for positions that can be found in n of them. Using literature it was established that probably all ICs form one big sector (a result found for other proteins as well).
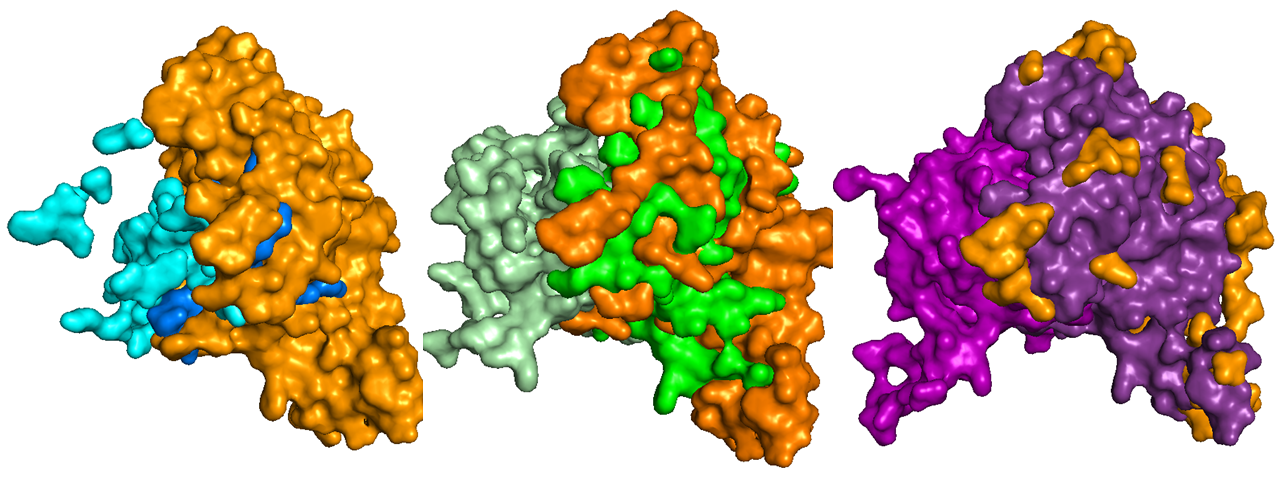
It was therefore decided to present three models, a conservative one (called blue model) that takes only positions that are present in all four sectors, a middle approach with positions found in 3/4 sectors (green model), and one that takes positions in 2/4 sectors (purple model). As one might expect, the first blue model was comparatively small while the purple model included most of the protein’s positions.
The image below shows the three models, blue, green and purple. The DHS has a homotetrameric structure, plotted here is the dimeric conformation. The left monomer of each model only shows positions that are part of the sector, while the right monomer shows the sector (in a different shade of the selected color) within the context of the rest of the monomer, evidenced in orange.
Conclusion
This work showed that it was possible to apply SCA to the DHS with certain limitations due to the high sequence similarity found in the used datasets. The presented models should therefore be considered more as an approximation to a true sector and less as a sector as defined by R. Ranganathan and its group. Testing these approximations by functional characterization of mutants should help in validating or disregarding the results from this work.